Report
Table of contents
Detailed Report
Welcome to PEACE COIN Explorer.
Open the explorer and check if it is your account.
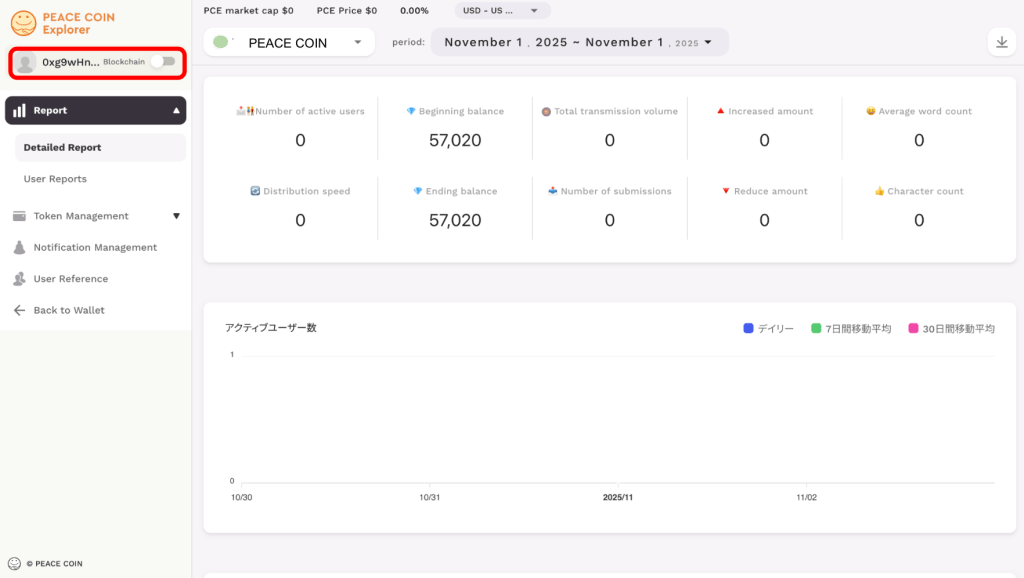
Select the pink report in the Explorer, then select the orange details report.

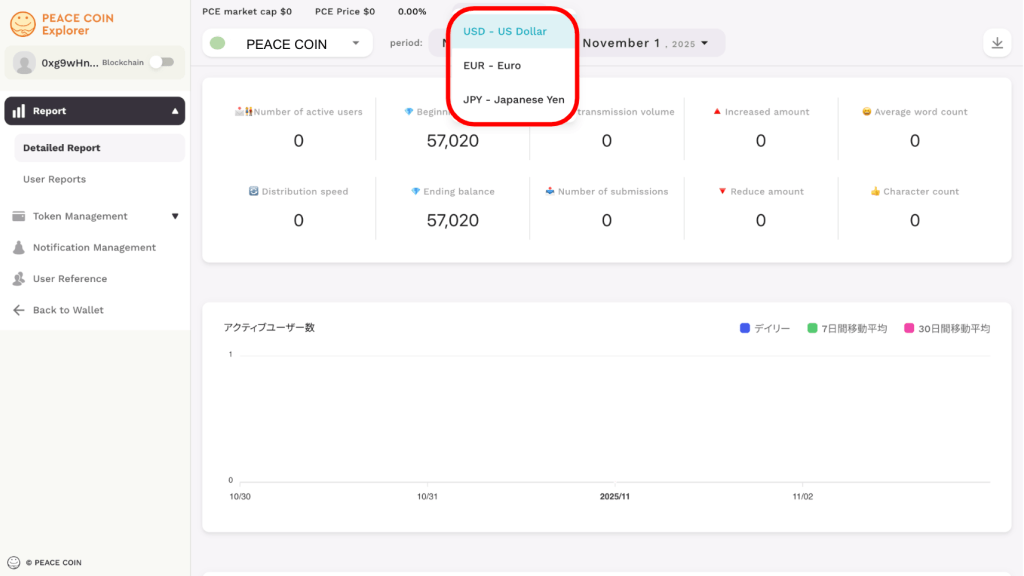
You can choose the currency displayed.
① You can check the token name to see if it is the token you want to see the report for.
② For the calendar, you can specify the report extraction period you want to display.
③ You can download the report. Please use it as an indicator of the community.
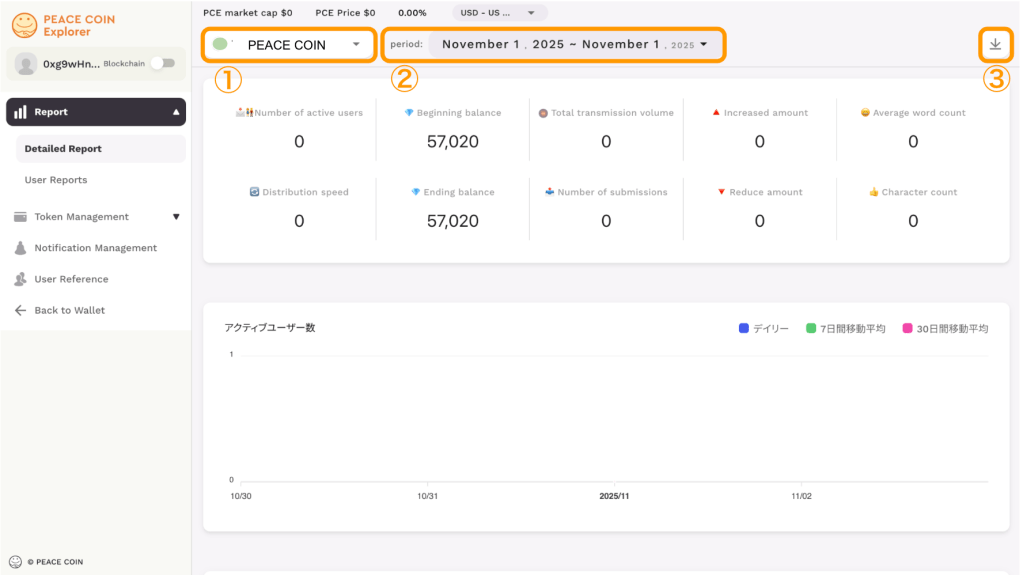
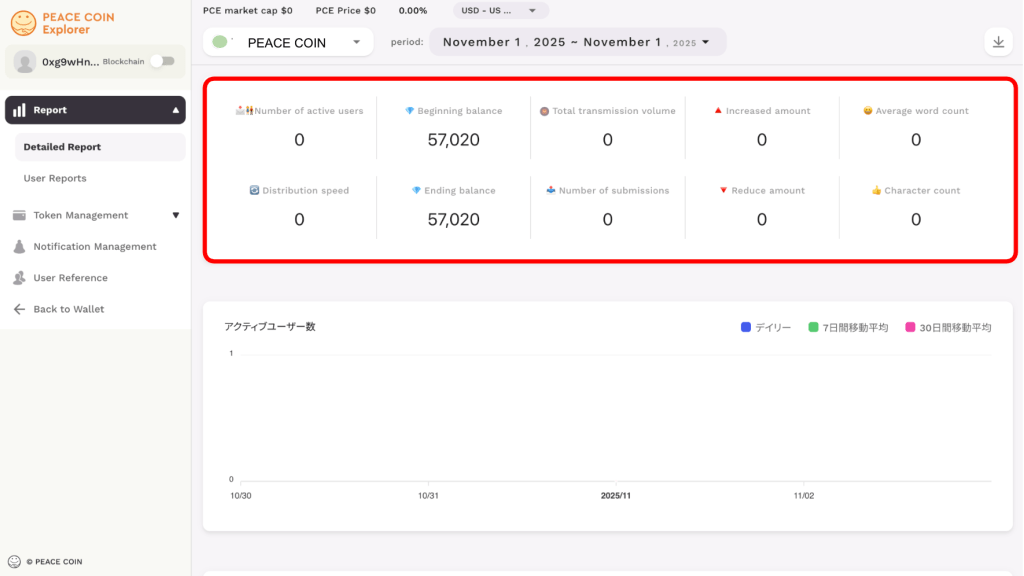
You can see total numbers of active users, balance, total sent amount, increment amount, distribution velocity, and more for a specified period.
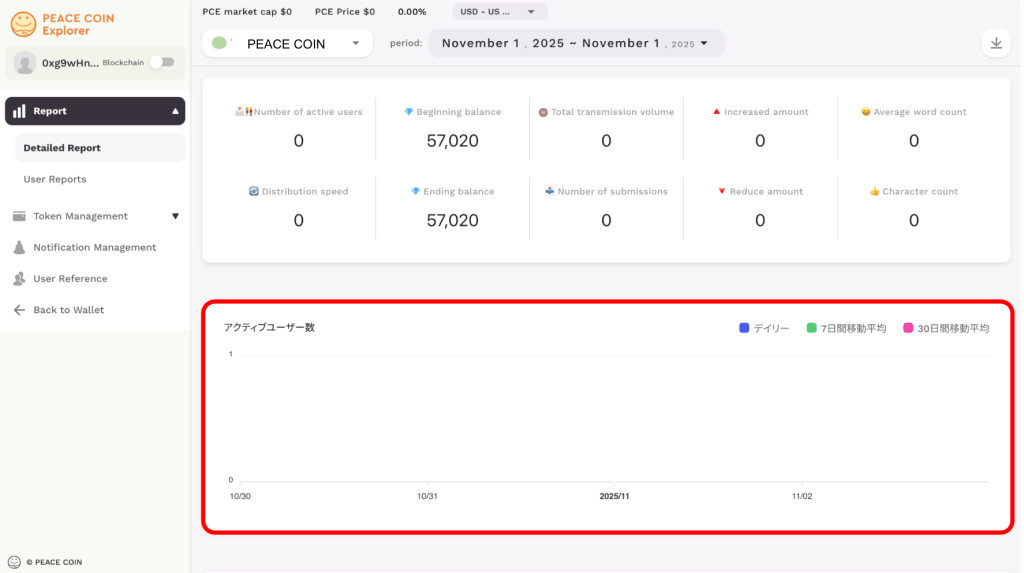
You can see the actual transition of active users.
You can monitor the transition daily, 7 days and 30 days.
You can get indicators such as trends after community events and announcements.
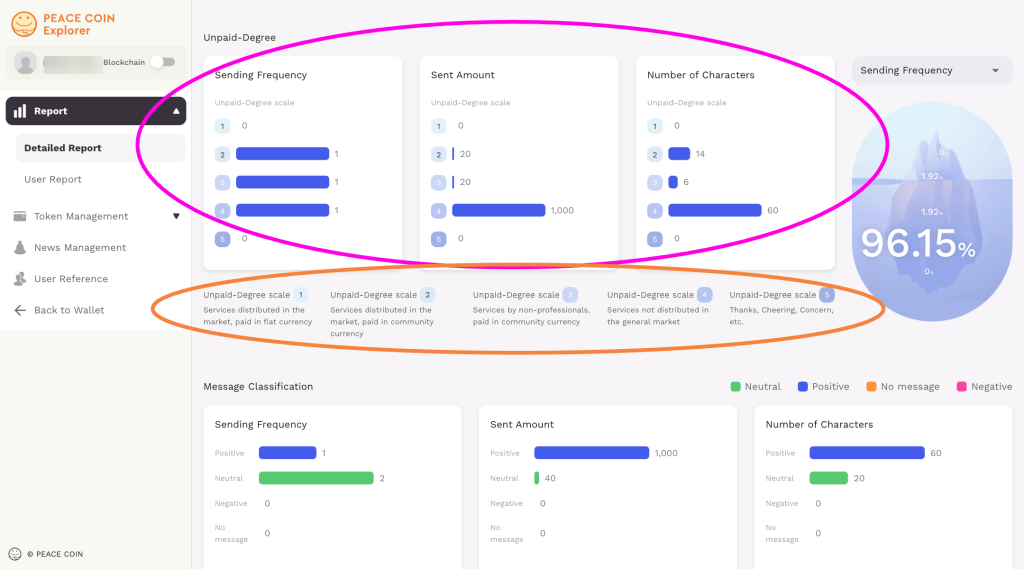
In the pink frame, you can see the various data of Unpaid-Degree (transmission frequency, transmission volume, number of characters sent in a message). In the orange frame, you can see the numerical explanation of Unpaid-Degree.
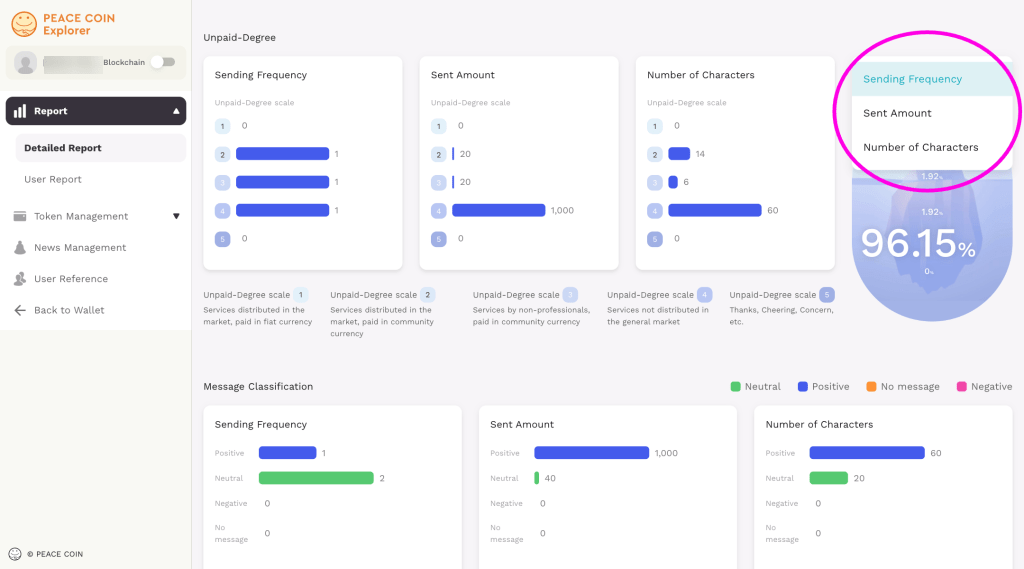
By selecting the options on the right side of the screen, you can see the current unpaid percentages for each item (transmission frequency, transmission volume, number of characters sent in a message).
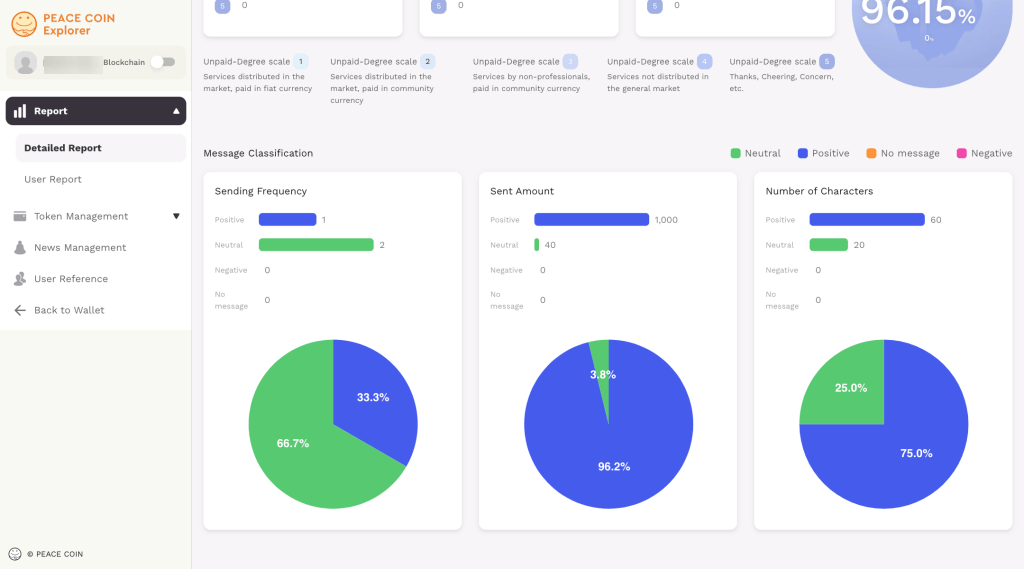
If you scroll further you can see the message categories.
Displayed as a pie chart, it visualises the message attributes (neutral, positive, no message, negative) and the user’s message at the time of sending.
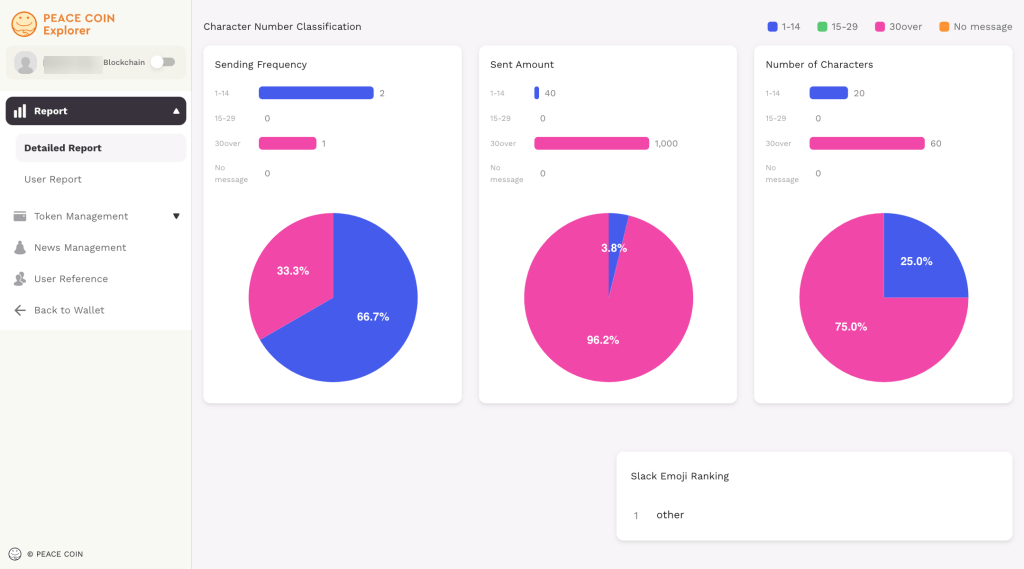
You can see the character count of the message itself.
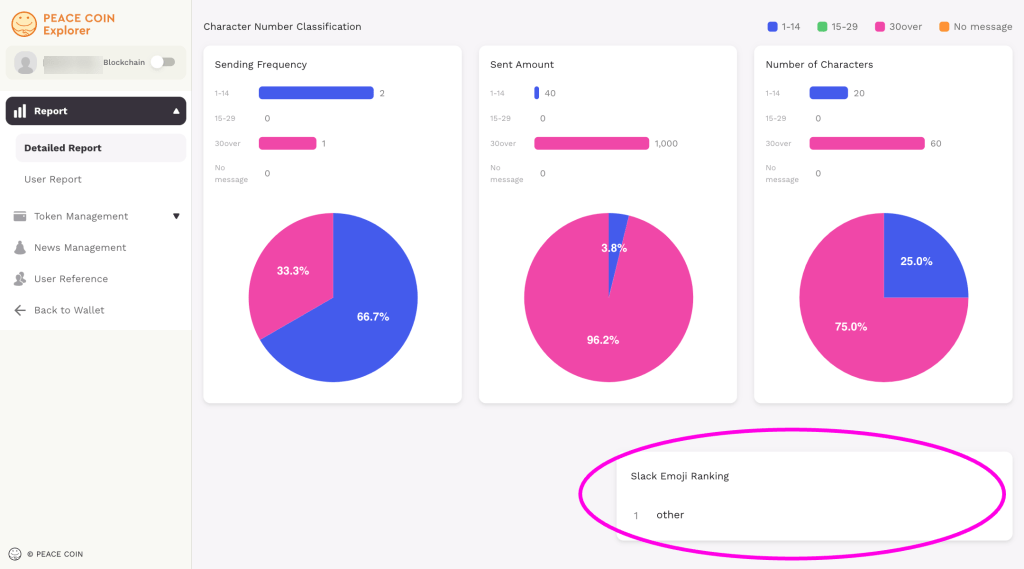
You can check the ranking of emojis used by users in Slack.
You can see a ranking of the most frequently used phrases in messages between users.
You can use trending comments within the community as an indicator.
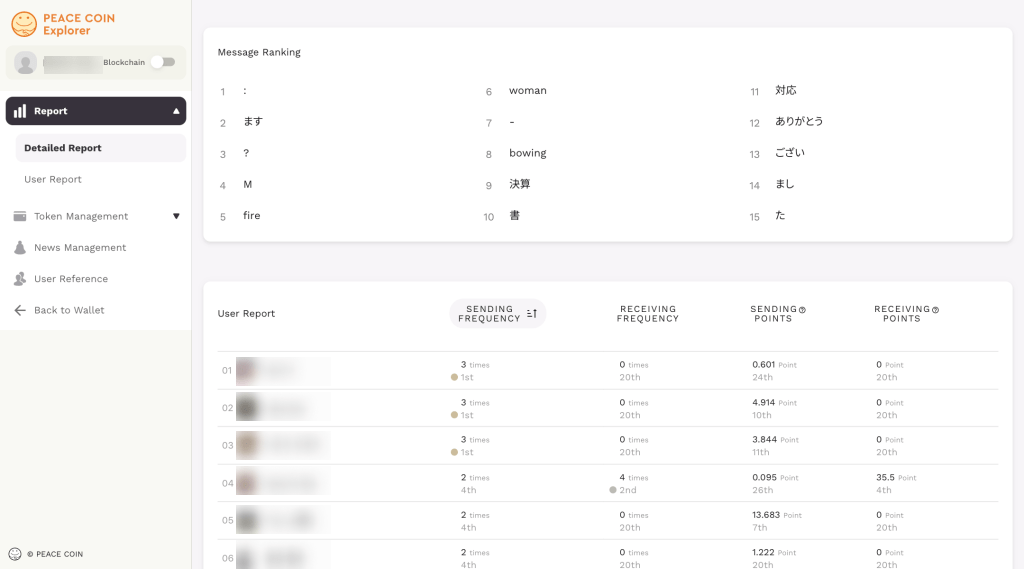
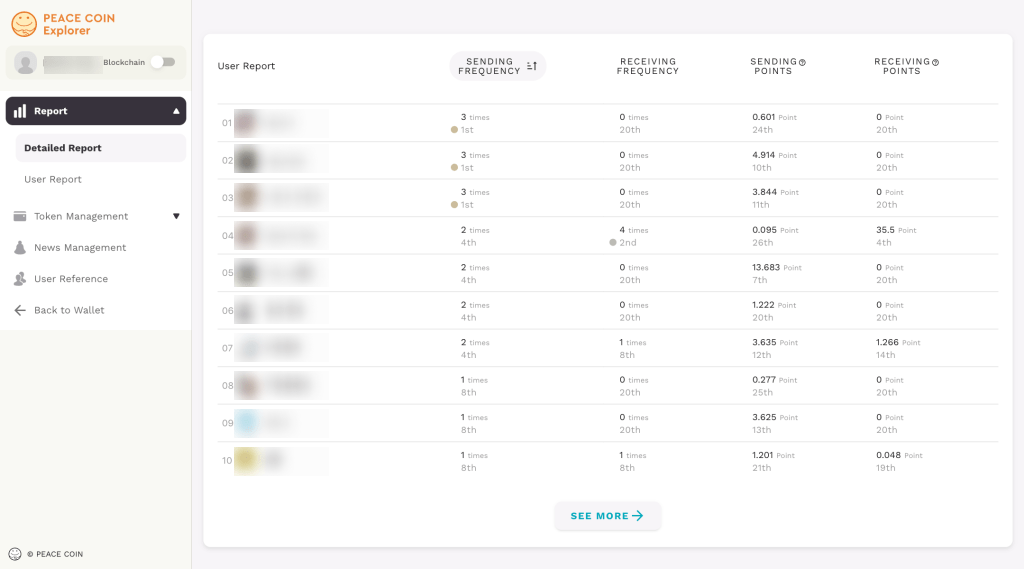
You can view user reports. You can see the number of times a user has sent messages, the number of times they have received messages, their sending points, and their receiving points in a ranking format. Let’s explore user trends.
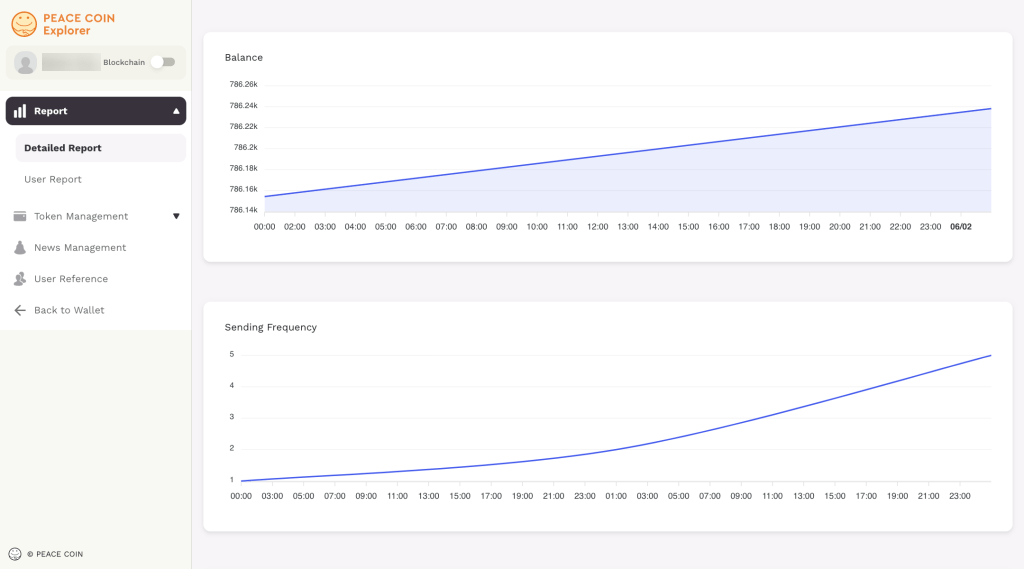
You can see the progress of your balance.
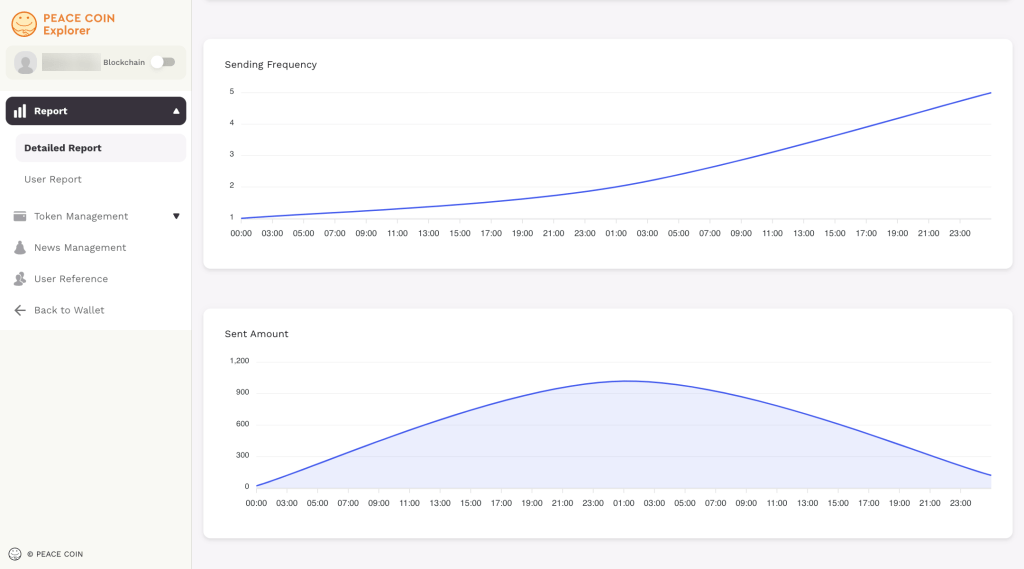
You can see the number of times sent and the amount sent.
You can see the increase and decrease.
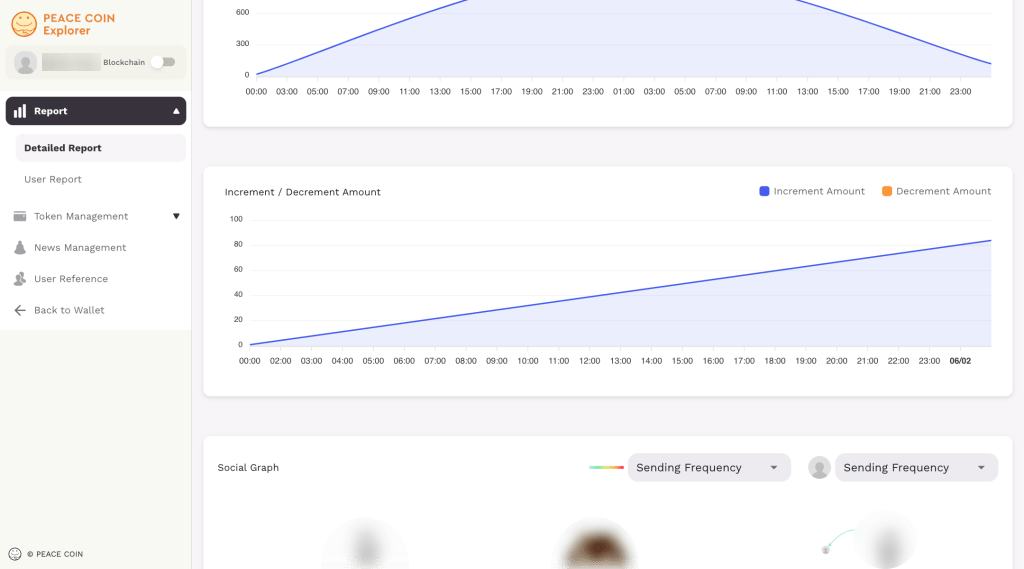
The social graph allows you to see the relationships between users.
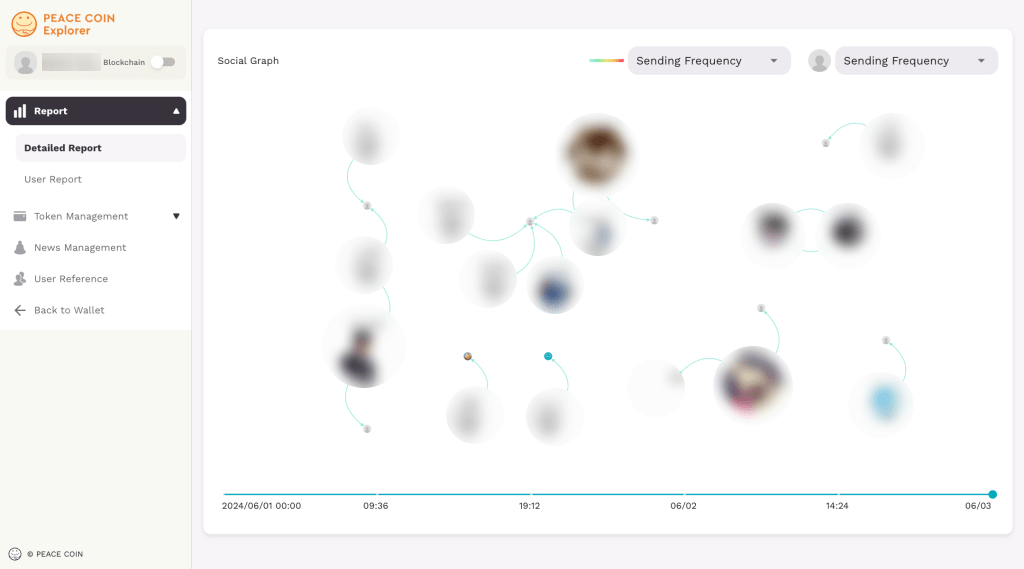
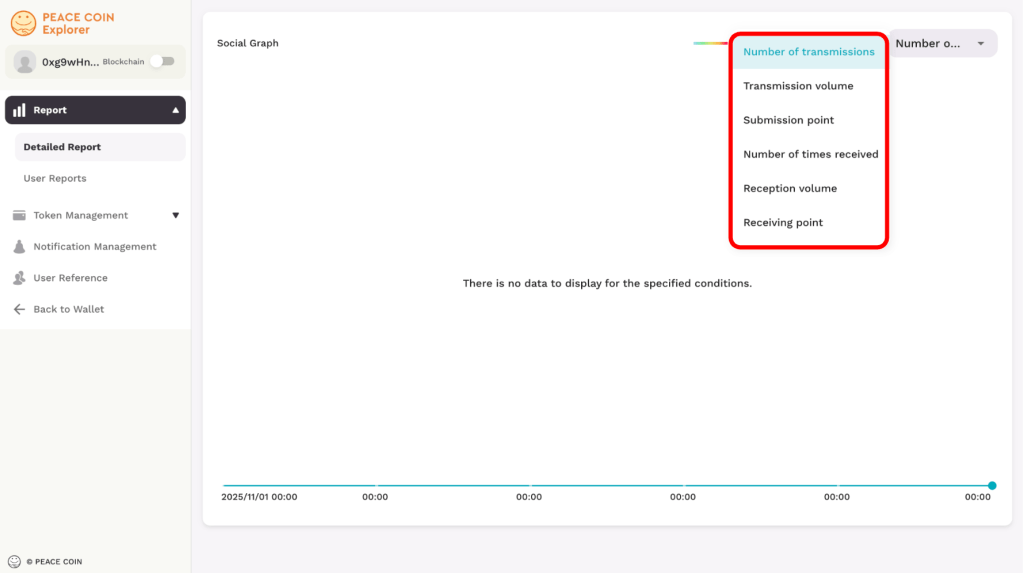
You can see the number of transmissions, amount of transmissions, transmission points, number of receptions, amount of receptions, and reception points for each “relationship” between users.
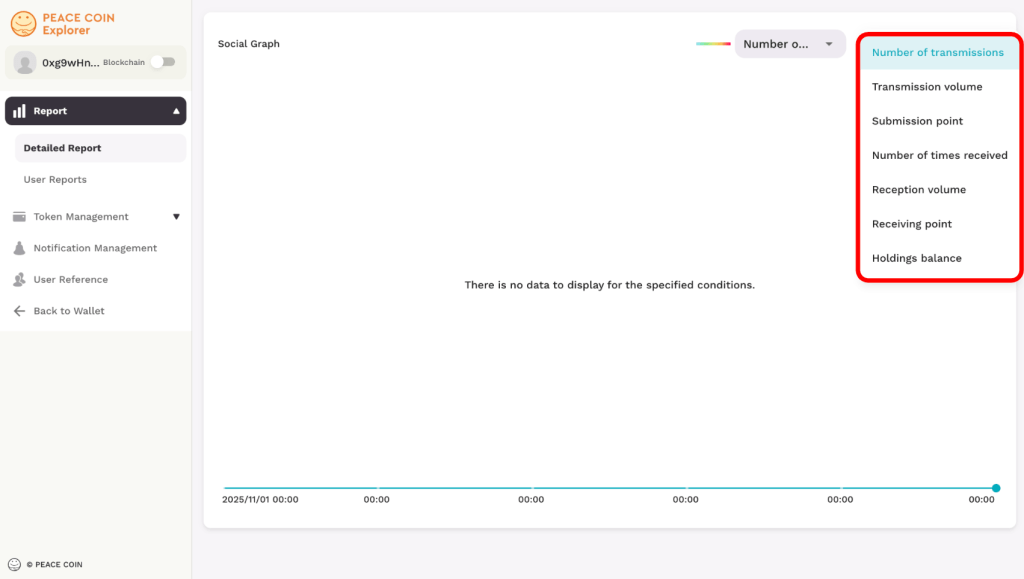
You can view each user’s sending volume, sending points, number of times received, receiving volume, receiving points, and remaining balance.
User Report
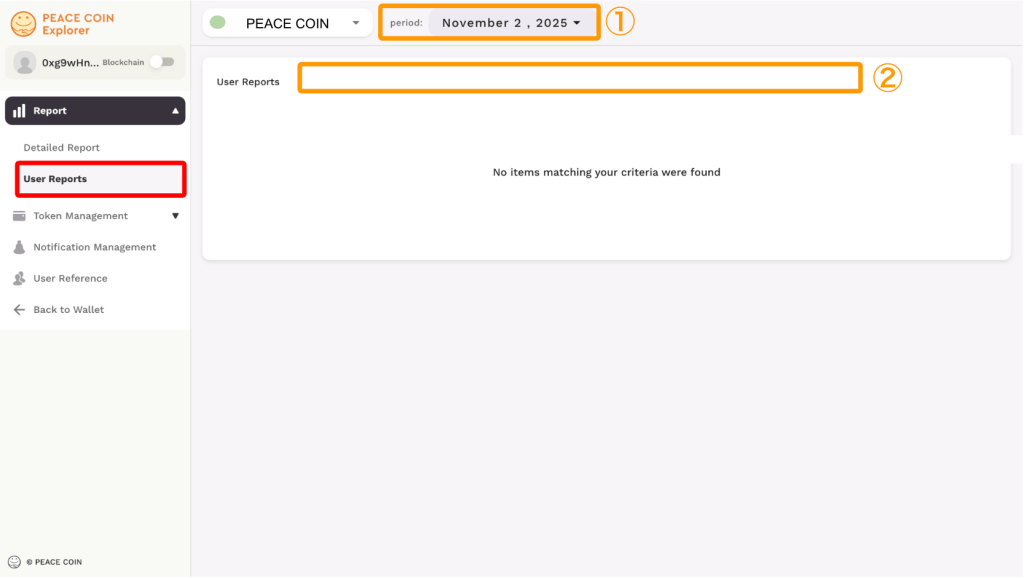
When you select a user report, the following screen will be displayed.
① You can select the period (calendar) for the user report.
② You can check the sent amount, sent points, receiving frequency, received amount, and received points in a ranking format. A special feature is that you can also check “what you can do” and “what you want someone to do.”